So I’m getting started with self-hosted trigger.dev, and there’s one big problem. I can’t see any logs when I run a task!
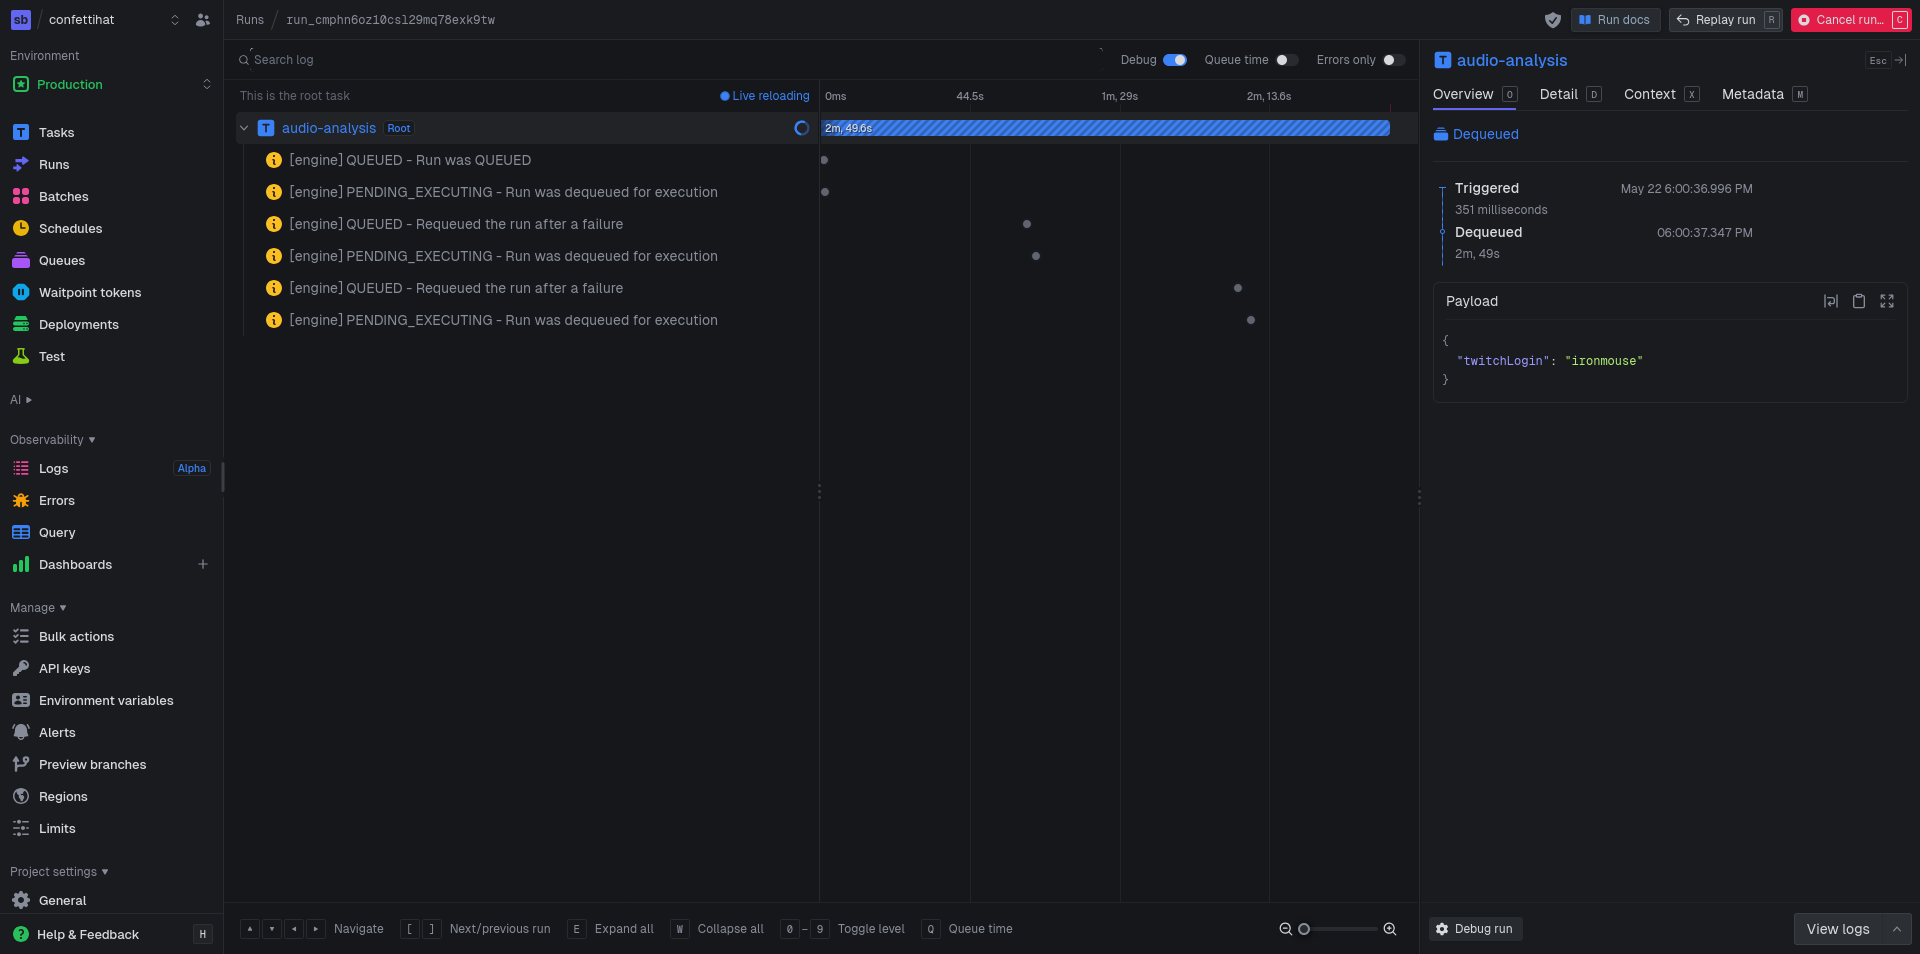 Where are the logs!? I think they’re supposed to be on this screen.
![[Trigger.dev walkthrough [YH_4c0K7fGM - 1280x720 - 3m23s].avif]] For reference, a trigger.dev tutorial video shows log activity.
To see what that trigger code contains, I found the tutorial page https://trigger.dev/docs/guides/examples/fal-ai-image-to-cartoon
It looks like the task uses logger.log(<message>, <metadata>). Simple, right? I’m totally doing that in my own task though. So why doesn’t it work?
Comparing code, it looks like the tutorial uses the following import.
import { logger, task } from "@trigger.dev/sdk";
Whereas my import looks like this.
import { logger, task, metadata } from "@trigger.dev/sdk/v3";
Oh, my import is using /v3 at the end. Could that be the problem? We are running version 4 of Trigger.dev after all. Let’s try to remove the /v3 suffix and try again.
Nah, didn’t seem to make a difference.
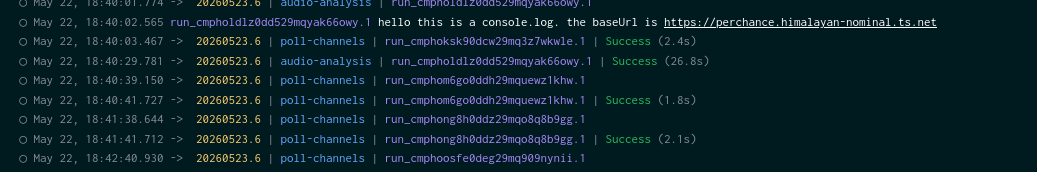
I shoved some console.logs in there. Apparently I can see their output in the console, but not the webUI. Here’s the output from bunx trigger.dev@latest dev --profile self-hosted
Ok so I’m curious. If we run in trigger.dev official cloud, can we see logs?
bunx trigger.dev@latest dev --profile cloud
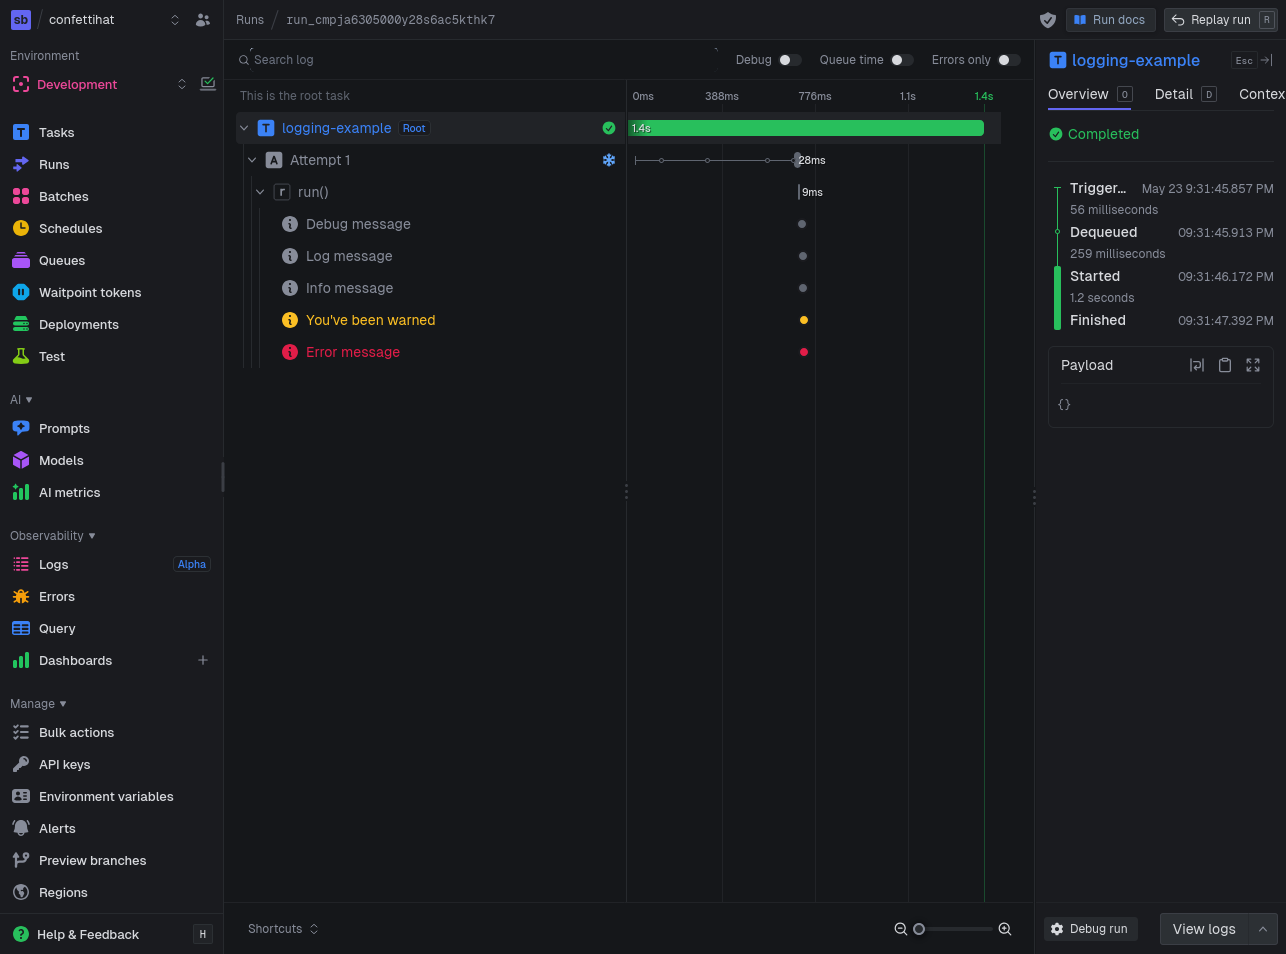
Holy shit, we can!
Transclude of Screenshot-2026-05-22-at-21-10-36-Trigger.dev.avif
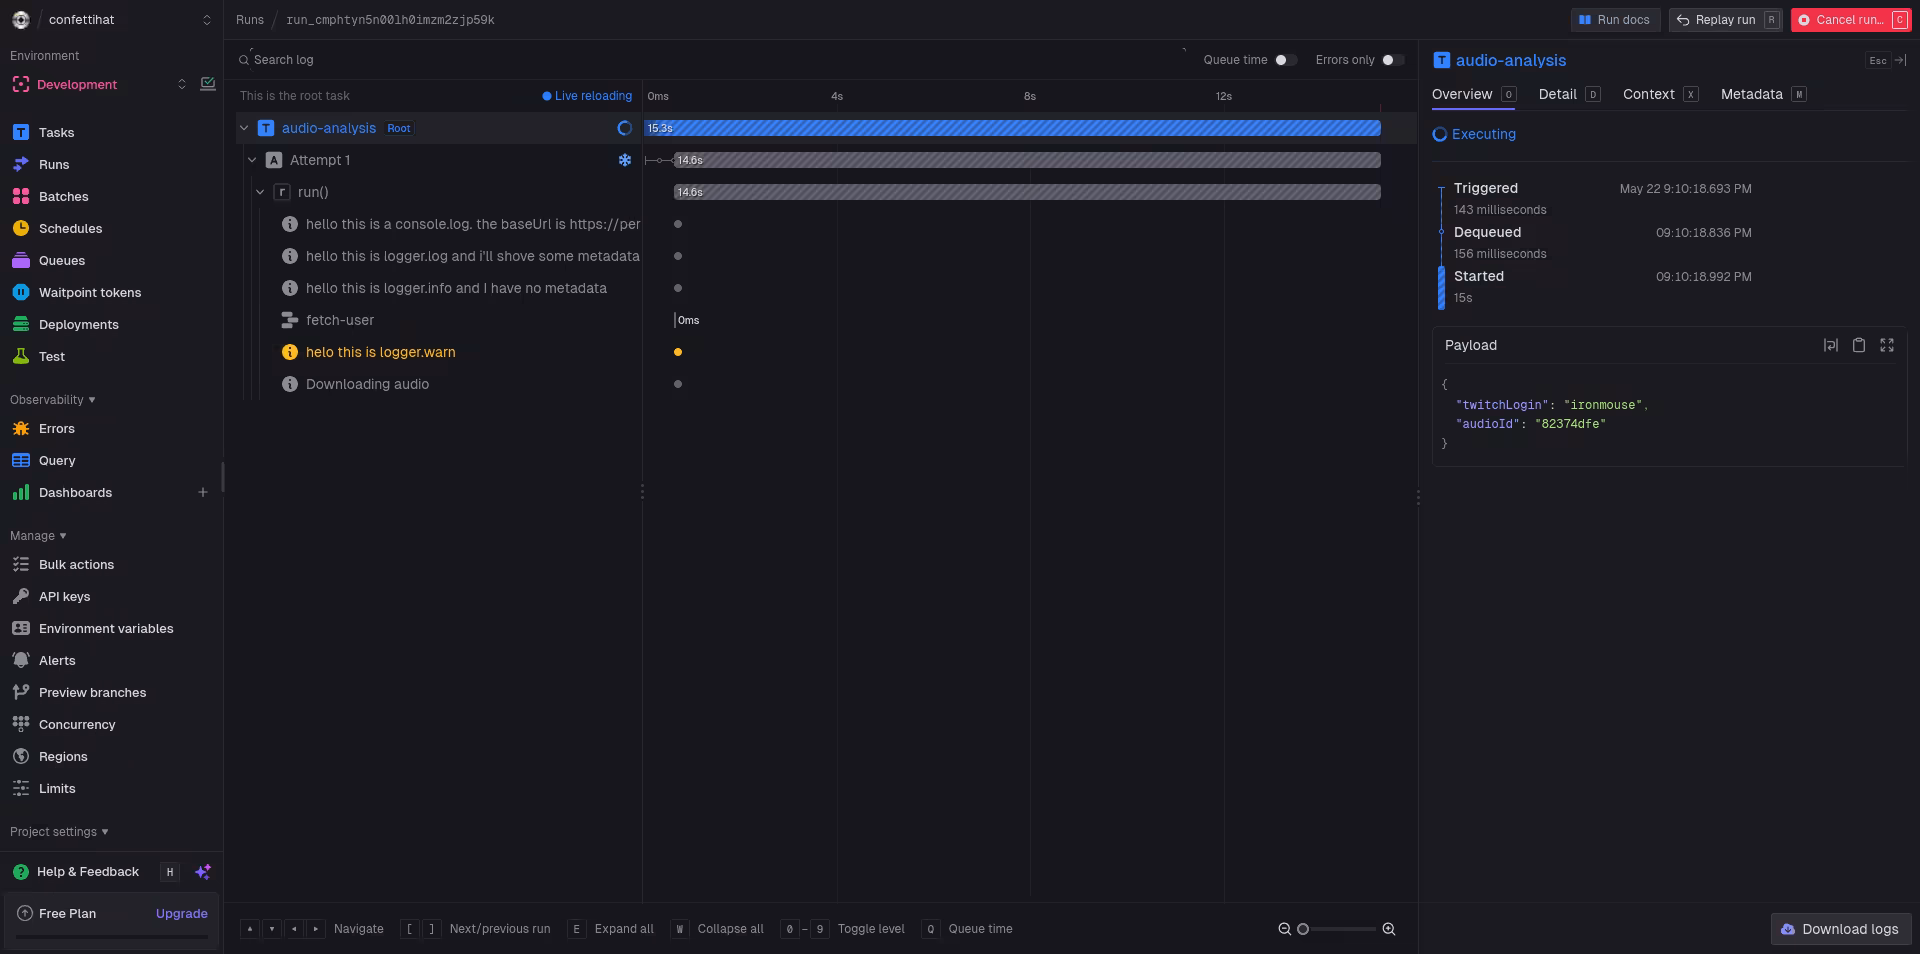
Ok let’s think about this. We can see logs in trigger.dev cloud, but not our self-hosted trigger.dev instance. This suggests that there’s a problem with our self-hosted configuration. What exactly is the difference in configurations between the two environments that is causing the problem? I wish I knew! But I don’t, so it’s my job to find out.
I ran out of leads, so I asked on the github discussions. IMMEDIATE RESPONSE HOLY COW SUCH LUCK TODAY!
https://github.com/triggerdotdev/trigger.dev/discussions/3718
For self-hosted Trigger, this usually means the run completed but event/log ingestion is not healthy (UI can show run status while logs/events stay empty).\n\nFast checks in order:\n1. Verify all Trigger services are on the same version (v4.6.6) and healthy (`web`, `worker`, and any event/log storage dependencies).\n2. Open browser devtools on the run page and check failing requests for run events/logs (4xx/5xx gives the exact missing component).\n3. Check worker/container env for required storage/queue vars and connectivity (DB/redis/object store depending on your setup).\n4. Trigger a tiny task with only `logger.info("hello")` and `console.log("hello")` to see if _any_ log path is working.\n\nYour `java.net.SocketException: Network is unreachable` in logs is a strong signal that at least one internal fetch path is failing from inside the container network. Fixing that network path usually restores event/log visibility too.\n\nIf you can share one failing request from the run page network tab (URL + status), we can pinpoint the exact component. If this solved it, please mark the answer so others can find it faster.
Holy shit, that was an AI agent. It fooled me at first! ACTUALLY MY LUCK IS TERRIBLE TODAY!
Firstly, it got the version wrong. I typed v4.6.6 in the title, but that version is wrong and they blindly copied it. v4.6.6 doesn’t exist— the real version is v4.4.6.
Then they incorrectly copied newlines (\n) into their message. Humans don’t do that.
Thirdly, they hallucinated this java error. java.net.SocketException: Network is unreachable That error was nowhere in my initial problem report.
Fucking waste of time clanker!
ok, let’s get back to it. let’s look at javascript logs on our trigger.dev webapp.
Firstly, I notice lots of requests to eu.posthog.com. Let’s disable those by setting TRIGGER_TELEMETRY_DISABLED=1 and POSTHOG_PROJECT_KEY=''(to an empty string) in our environment variables.
I think we should be looking for mentions of OpenTelemetry, not logs, as this is what it’s referred to in the docs. https://trigger.dev/docs/config/config-file#instrumentations
Could it be this env var? DEV_OTEL_EXPORTER_OTLP_ENDPOINT
looking in my env vars, it was unset! Could that be the issue? I set it to http://trigger:3000/otel and restarted the trigger resource via Coolify.
Nah, didn’t help.
Let’s link to Trigger.dev Discord conversations on the topic.
- missing logs by mikirejf. They worked around the issue by downgrading to beta.26
- v4 of trigger dev not logging by rafaelsene01. I don’t think they solved their issue.
- logs are not reliably coming through by juienvanbeveren. The conversation suggested ensuring clickhouse was properly configured. https://github.com/triggerdotdev/trigger.dev/blob/892bed8c4c775ceb847020f68a0e72d4a043c0ba/apps/webapp/app/env.server.ts#L1137-L1156
- log messages don’t show up in the task runs by Emad Ibrahim. Trigger.dev staff said, “Logs for dev get sent to the API server and use open telemetry. I’d try do some logs from a dev run and look at the server logs and see what you get. Something is misconfigured somewhere. Compare our self-hosting guide with your setup too.”
- detailed logs missing by Leoodaviid Staff said, ”- Runs can execute correctly but logs don’t come through. That’s usually when your OTEL collector isn’t setup correctly Which means the logs never make it from your running machine into the db”
- Can not see any logs on trigger run by Phillip. I don’t think they solved their issue.
- No logs or details after upgrading the machine to large-1x by praneethpike. (This was on the cloud version of trigger.dev.) They resolved their problem by switching their region from us-east-1 to europe
- Logs only shows root task by blekekok. Erin said this is usually caused by
OTEL_EXPORTER_OTLP_ENDPOINTdefined incorrectly. Nick said to check this env var which in the example is the FQDN URL (eg: https://trigger.sbtp.xyz), not the local-to-docker http://trigger:3000/otel like I have my set as.
Yeah ok so I think we have identified our problem. Finally!
Next I neeed to figure out if my env var settings are actually having an effect. Is the Coolify resource restart after changing an env var enough? Are my settings sticking?
CONFIRMATIVE! restarting the Coolify resource after changing an env var is enough. I confirmed this by setting OTEL_EXPORTER_OTLP_ENDPOINT to an empty string. In the supervisor logs, I saw this error.
Node.js v22.14.0
file:///app/apps/supervisor/node_modules/.pnpm/zod@3.25.76/node_modules/zod/v3/types.js:39
                const error = new ZodError(ctx.common.issues);
                              ^
ZodError: [
  {
    "validation": "url",
    "code": "invalid_string",
    "message": "Invalid url",
    "path": [
      "OTEL_EXPORTER_OTLP_ENDPOINT"
    ]
  }
]
    at get error (file:///app/apps/supervisor/node_modules/.pnpm/zod@3.25.76/node_modules/zod/v3/types.js:39:31)
    at ZodEffects.parse (file:///app/apps/supervisor/node_modules/.pnpm/zod@3.25.76/node_modules/zod/v3/types.js:114:22)
    at file:///app/apps/supervisor/dist/env.js:250:24
    at ModuleJob.run (node:internal/modules/esm/module_job:271:25)
    at async onImport.tracePromise.__proto__ (node:internal/modules/esm/loader:578:26)
    at async asyncRunEntryPointWithESMLoader (node:internal/modules/run_main:116:5) {
  issues: [
    {
      validation: 'url',
      code: 'invalid_string',
      message: 'Invalid url',
      path: [ 'OTEL_EXPORTER_OTLP_ENDPOINT' ]
    }
  ],
  addIssue: [Function (anonymous)],
  addIssues: [Function (anonymous)],
  errors: [
    {
      validation: 'url',
      code: 'invalid_string',
      message: 'Invalid url',
/app/apps/supervisor:
      path: [ 'OTEL_EXPORTER_OTLP_ENDPOINT' ]
    }
  ]
}
I just noticed something in the network requests tab of my browser devtools.
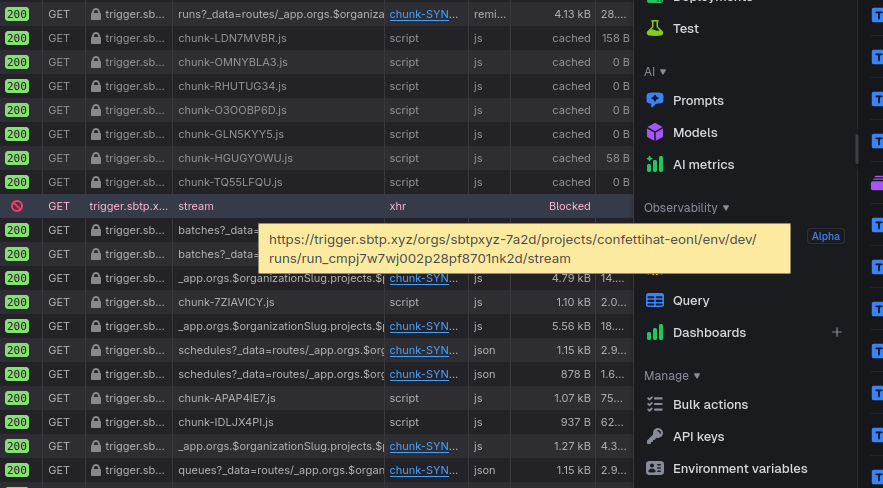 A blocked stream? That seems important.
Turns out it was a transient error. I can’t reproduce it. Maybe it occurred while I was restarting one of the services.
Anyway, back on the hunt. What could be wrong with our opentelemetry?
Ok so taking a look at these env vars https://github.com/triggerdotdev/trigger.dev/blob/eefb96c87d95ac48ea92a4012306549b1628e5e9/hosting/docker/.env.example#L46
I think I might have the wrong url set. I think I need to be using https://trigger.sbtp.xyz/otel, not http://trigger:3000/otel
ohhhhhhhhhhh, that’s almost certainly the issue. I finally put 2 and 2 together and I’m realizing that the tasks have been running on my local computer, not the cloud. This whole time, I misunderstood the trigger.dev architecture.
When I run bunx trigger.dev@latest dev --api-url https://trigger.sbtp.xyz --profile self-hosted, that’s setting up the tasks to be run on my local computer! When tasks emit traces, they get sent to the webapp’s /otel endpoint. I had that endpoint set to http://trigger:3000/otel because I assumed the tasks were running on Coolify. That assumption was incorrect!
Ok so now that I changed the DEV_OTEL_EXPORTER_OTLP_ENDPOINT and OTEL_EXPORTER_OTLP_ENDPOINT to https://trigger.sbtp.xyz/otel, then restart my bunx trigger.dev@latest dev (...) I get an error.
`X Error: Failed to connect to [https://trigger.sbtp.xyz:3000.](https://trigger.sbtp.xyz:3000.) Couldn't retrieve settings: Connection error.` `file:///tmp/bunx-1000-trigger.dev@latest/node_modules/trigger.dev/dist/esm/dev/devSupervisor.js:59` ``throw new Error(`Failed to connect to ${this.options.client.apiURL}. Couldn't retrieve settings: ${settings.error}`);`` `^` `Error: Failed to connect to [https://trigger.sbtp.xyz:3000.](https://trigger.sbtp.xyz:3000.) Couldn't retrieve settings: Connection error.` `at DevSupervisor.init (file:///tmp/bunx-1000-trigger.dev@latest/node_modules/trigger.dev/dist/esm/dev/devSupervisor.js:59:19)` `at process.processTicksAndRejections (node:internal/process/task_queues:104:5)` `at async startWorkerRuntime (file:///tmp/bunx-1000-trigger.dev@latest/node_modules/trigger.dev/dist/esm/dev/devSupervisor.js:20:5)` `at async startDevSession (file:///tmp/bunx-1000-trigger.dev@latest/node_modules/trigger.dev/dist/esm/dev/devSession.js:17:21)` `at async startDev (file:///tmp/bunx-1000-trigger.dev@latest/node_modules/trigger.dev/dist/esm/commands/dev.js:191:23)` `at async devCommand (file:///tmp/bunx-1000-trigger.dev@latest/node_modules/trigger.dev/dist/esm/commands/dev.js:119:29)` `at async file:///tmp/bunx-1000-trigger.dev@latest/node_modules/trigger.dev/dist/esm/commands/dev.js:62:13` `at async wrapCommandAction (file:///tmp/bunx-1000-trigger.dev@latest/node_modules/trigger.dev/dist/esm/cli/common.js:47:24)`
Where is it getting that port 3000 from? I didn’t put that there!
Oh, my APP_ORIGIN was wrong. I updated that, and restarted everything.
HOLY SHIT IT’S WORKING!
 PROBLEM SOLVED. THANK GOD!
Only took me 4 days of troubleshooting! But sometimes, that’s what it takes.
gg